
The best KPIs for your dental practice
Every dentist in 2019 has the capability to walk into their office, fire up their computer, and view comparatives and analytics that tell them how their practice is performing. They can spot opportunities and proactively solve issues before they become major practice management issues.
Does every dentist do this? Of course not.
In almost every case the limitations are either:
They don’t have the technology to automate this sort of analytics
They don’t know what to look for, what to track
According to Amy Morgan of Pride Institute and her post, Innovative solutions for the modern dental practice, the secret to feeling in control of your business is to manage by statistics.
So what dental practice management statistics do you manage by? In this post we will break down the most important KPIs for managing your dental practice’s finances, customers, operations, and ongoing education of personnel.
Key indicators for financial success
The number one goal of any business is improving profitability. There are really only two ways to do so: increase revenue or decrease costs.
So for a dental practice, the lowest hanging fruits are to increase the average revenue per patient or to decrease overhead.
KPIs for increasing average revenue per patient
The following KPIs will provide insight into strategic initiatives for increasing revenue per patient:
Annual Production Per Active Patient
To calculate you’ll need to measure the profit generated by each patient in 1 year. For this calculation we will ignore the cost to acquire the patient since ideally your patients stay with you for more than 1 year. So you’ll need to understand the fee per patient, less the cost of care.
Your target for production per patient should be around $800/yr. Brainstorm ways to increase your current production per active patient, like performing health exams, cosmetic dentistry evaluations, and developing your treatment plans.
Payments Collection Ratio
In accounting terms, this is your accounts receivable days - how long does it take you to collect on what is owed? Studies show that dentists need to collect payments in a 2 month period or your chances of collection go down significantly.
There are two ways to measure your collections: Accounts receivable days
(Accounts receivable / annual revenue ) x Number of days in period
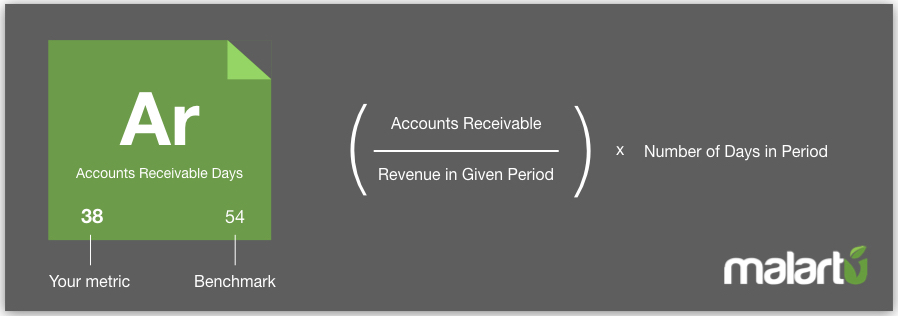
Or, a simpler goal, set a target for collection before the two month mark.
For the sake of simplicity, target to collect more than 98% of your payments before 2 months pass. You can improve this by informing patients before treatment about the fees associated and introduce the possibility to pay upfront.
Offer New Treatment Plans
Measure new treatment plans by their treatment acceptance rate. You need to know how effectively your team explains new treatments to patients to identify opportunities. The industry benchmark for treatment acceptance rates is 50%, so if your team is below this mark, you’ll need to invest more in training.
To measure your acceptance rate calculate: Total production volume (in $) / number of full time employees

Improving Patient Engagement
Patient engagement is closely related to your average revenue per patient and encapsulates most of the efforts and KPIs described above. Button up your patient engagement by developing a welcome campaign for new patients:
Include material on treatment plans
Provide clear explainer material on more complex health exams
Now lets take a look at your costs. Having a complete understanding of where you’re spending is equally important to boosting profitability.
Monitoring and decreasing costs
Today, a general dentist’s overhead averages 75% of income. That means for every dollar you bring in, you’ll only net 25 cents. Like we just mentioned, if you don’t have a solid hold on your collections, this ratio can decrease even more.
Overhead costs are all of the costs associated with running your practice.
To monitor your overhead, calculate each expense as a percent of income. Example of overhead costs might be:
Staff
Lab
Rent
Equipment
Office Supplies
Dental Supplies
Marketing
Your staff will be your largest overhead expense by a good margin (this is true for almost any business).
With that being said, most folks try to decrease costs by doing things like renegotiating supply contracts. In reality this may only decrease 20% of a cost that makes up 5% of your overhead expenses.
That’s not an effective strategy.
The real way to decrease overhead is through building systems related to your staff - making them as efficient as possible.
Decreasing the number of no-shows
Your no-show rate, or FTA (failed to attend), is a huge cost driver for your practice. You should aim for this to be less than 10% of booked appointments.
To reduce your no-show rate, there are a few things you’ll need to do:
Calculate the cost of someone failing to attend an appointment to understand if FTA is important for your practice. This will also help to get a buy-in from the stakeholders.
Develop a response time. A simple system to remind patients will typically do the trick.
Analyze the profile of the clients where FTA is typical, then tailor your marketing away from that type of patient. For example, have you found that many of your no-shows are unemployed? Make employment benefits prominent in your marketing materials.
All of this boils down to your profitability percentage
Finally, to get a holistic view of your profitability, monitor the improvement of your profit margin (net income / total revenue).
If you’ve hired a strategic consultant, at the end of the day you should be measuring them by an increase in your profit margin. Plain and simple.

These metrics also measure a happy customer base
While the KPIs we’ve mentioned have a major impact on profit margin, they also impact patient happiness. Happy patients stay with you, and customer retention is what all successful businesses are built on.
Here’s what we mean:
Improving payments collection ratio not only indicates positive cashflow but also that patients and payers are generally happy with your services.
Seeing high adoption rates of treatment plans means your patients are having positive interactions with staff and buying into the long-term care you provide. This also means your marketing materials are high-quality, which bodes well for your future.
Improved patient engagement means you will learn about issues before they become major problems and can implement solutions. Highly engaged patients give you the opportunity to improve before they churn away, and as we’ll discuss in a moment, patient churn is something to keep at a bare minimum.
A reduction in FTAs is a good indicator in the strength of your patient community and the services you provide them. Additionally, highly utilized staff are more empowered than underutilized staff. Their work is fulfilling because it is high-impact. Happy staff members will lead to happier customers.
KPIs for running a smooth operation
With a hold on profitability and patient happiness it’s time to think about growth. Your KPI system should incorporate metrics that track growth, new patients, and marketing effectiveness.
Patient Churn
Viewed, as a percent of patients who leave your practice each year, this is calculated by dividing the number of patients lost per year by the total number of patients

Use exit surveys to understand if the patient stops coming to you because of care quality or because of more unavoidable reasons such as relocation. If you find a problem, you need to initiate quality assurance procedures, e.g. prevent similar problems from occurring.
Typically you should target losing no more than 5% of patients per year.
Percent New Patients
Any business loses a certain percentage of patients per year. To stay in the business and grow you need to find new patients regularly. To do this, develop a marketing system that promotes your practice, attracts new patients, and nurtures new patients to increase retention.
Your target new patients should exceed those that you are losing (or you’re not growing). Otherwise, a good mark is around 7% growth from new patients.
New Patient Conversion Rate
Use this KPI to find out how efficient your marketing system is. You will need to track leads that were qualified as a result of marketing and how they end up in the long-term. Understanding the performance of marketing qualified leads vs patient referrals is key to building an efficient marketing system.
Finally, employee education is the last step to long-term success.
Tracking Employee Education for Ongoing Success
A business that can’t survive without its owner is a business built to fail. It’s important to the long-term health of your dental practice to manage employee education and empower your staff to lead your practice for tomorrow. After all, you will not be able to reach your personal goals unless the practice can run itself.
Annual Production Per Full Time Employee
This is calculated by dividing the total profit of your practice by the total number of full time employees.
While the benchmark for production varies from location, a good mark in the US is to target around $15,000 per employee per year. Like we mentioned before, the best way to improve this metric is to implement systems in your operation, ensuring the success of each employee.

Understand the Health of Your Dental Practice Today.
Start a free trial of Malartu’s dental practice management board.
Related Articles

The guide to understanding and tracking the financial health of a dental practice.